In 2017, the growth rate of national trade in goods hit a six-year high, with a total import and export value of US$4.10448 billion, a year-on-year increase of 11.4%. Among them, exports were US$2.26349 billion, an increase of 7.9%; imports were US$1.84099 billion, an increase of 15.9%, with a cumulative trade surplus of US$422.51 billion. In December 2017, the total import and export value of national trade in goods was US$408.89 billion, an increase of 8%. Among them, exports were US$231.79 billion, an increase of 10.9%; imports were US$177.10 billion, an increase of 4.5%. The trade surplus for the month was US$54.69 billion.
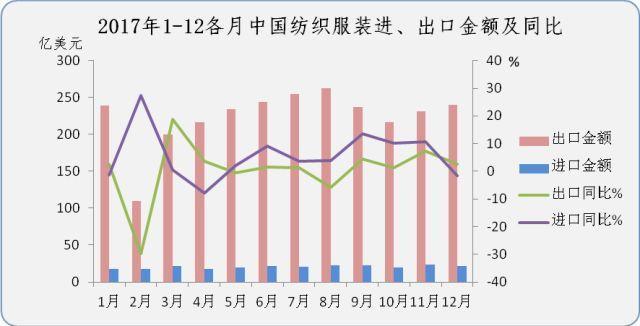
In 2017, the cumulative trade volume of textiles and apparel was US$293.15 billion, an increase of 1.2%, of which exports were US$268.6 billion, an increase of 0.8%, and imports were US$24.55 billion, an increase of 5.3%. The cumulative trade surplus was US$244.05 billion, an increase of 0.4%. In December 2017, the textile and apparel trade volume was US$26.18 billion, an increase of 2.2%, of which exports were US$24.02 billion, an increase of 2.5%, and imports were US$2.16 billion, a decrease of 1.6%. The trade surplus for the month was US$21.86 billion, an increase of 2.9%.
The import and export of textiles and clothing in 2017 showed the following characteristics:
1. Stable improvement, with exports growing again throughout the year.
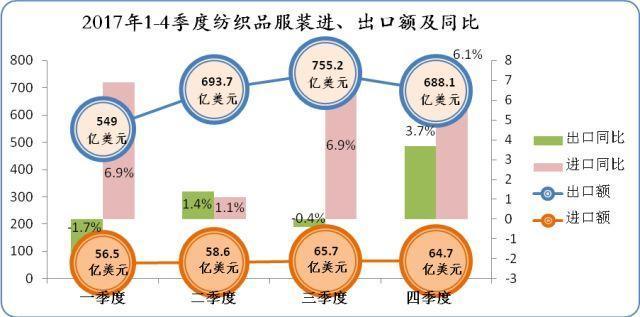
Under the combined effects of the global economic recovery, external demand is picking up, the domestic economy continues to improve, and the base is low in the same period last year, China’s textile and apparel foreign trade has always been “stable” in 2017, especially in the second half of the year, exports have been exported for many consecutive months. Maintaining steady and slight growth, the growth rate rose to 3.7% in the fourth quarter, allowing full-year exports to finally clear up and achieve growth again after two consecutive years of decline.
Imports, driven by the dual-engine improvement of quantity and price, reversed three consecutive years of decline and achieved rapid growth.
2. The trade structure has become more reasonable and foreign trade concentration has further increased.
From the perspective of trade methods and export enterprises, there are three further optimization features in 2017:
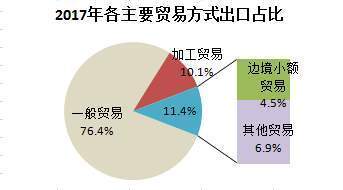
The trade structure becomes more reasonable. General trade exports, which reflect the ability to develop independent foreign trade, accounted for 76.4%, ranking firmly at 3/4. Exports in the form of “other trade”, which is mainly based on market procurement, have become more prominent, accounting for 6.9%. General trade exports decreased slightly by 0.4%, while other trade exports increased by 16.6%, promoting overall export growth.
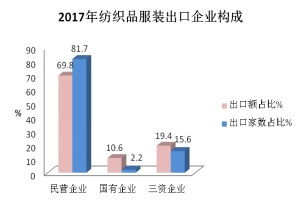
The corporate structure is further optimized. The cumulative exports of private enterprises reached US$187.55 billion, accounting for a record high of 70%. The export volume increased by 3%, becoming the only driving force for overall export growth. The endogenous driving force for foreign trade development has become stronger. The exports of state-owned enterprises and foreign-funded enterprises decreased by 3.6% and 4.4% respectively.
Foreign trade concentration has further increased. Super-large and large enterprises (with an export value of more than 50 million US dollars), which only account for 0.7% of the number of export entrepreneurs, contribute 30% of the export value. The trend of Evergrande and Evergrande is gradually taking shape.
The comprehensive foreign trade service platform that performed outstandingly last year has lost much of its luster in 2017. The exports of “One-stop” companies have rapidly shrunk, and the rankings of “One-stop service” in Shandong and Fujian have fallen sharply. Most of the top 10 export companies have returned to specialized textile and apparel production or foreign trade companies.
3. Key markets have shown a stabilizing and improving trend, and exports to the United States, ASEAN, and Japan have resumed growth.
European Union – The decline in exports to the EU has narrowed, and the impact of Brexit is expected to be more beneficial than harmful.
In 2017, among the four major export markets of textiles and apparel, only exports to the EU declined. The cumulative export volume was US$48.86 billion, a decrease of 1.1%, and the decline was significantly smaller than last year. The main reason was that clothing decreased by 2.7%, while textiles achieved a growth of 3.9%. The total export volume of needle-woven garments of major categories of commodities increased slightly by 0.5%, and the export unit price fell by 3.8%.
Brexit is a major event in the EU in recent years. In 2017, Brexit entered the substantive negotiation stage, and the specific time and transition period for Brexit have been basically determined. The UK is an important export market for my country’s textile and apparel products, ranking fifth among individual countries and the largest market among the 28 EU countries. In 2017, my country’s exports to the UK were US$10.33 billion, accounting for 4% of total global exports and 21% of exports to the EU.
In the next two years, as the negotiation process advances, the UK will gradually divest itself of the original EU institutional arrangements and formulate and improve its own policies in financial taxation and trade relief. Brexit has both advantages and disadvantages for China. However, since the UK has always advocated a global free trade system, its general foreign trade policy is expected to still be based on openness, and the overall advantages for my country’s exports outweigh the disadvantages.
According to EU customs statistics, the EU imported US$109.33 billion in textiles and clothing from the world from January to October, an increase of 2.8%, and imported US$37.42 billion from China, an increase of 1.3%. Imports from ASEAN and Bangladesh increased by 9.9% and 3.4% respectively.
United States—Exports to the United States resumed growth, driven by textiles.
Affected by the sluggish local economy, my country’s exports to the United States fell for the first time in 20 years in 2016. The U.S. economy recovered steadily in 2017, with all basic.4%, and the total export volume of needle and woven garments increased by 2.8%. The export price of yarn increased by 2.1%, while the price of fabrics and needle-woven garments fell by 4% and 4.9% respectively. The decline in export prices has not been completely reversed.
5. The eastern region has resumed growth and Xinjiang’s export status has been upgraded.
In 2017, the top five traditional export provinces Zhejiang, Jiangsu, and Shandong achieved growth of 0.9%, 7.4%, and 2.3% respectively, while Guangdong and Fujian decreased by 1.9% and 5.1%. By region, the eastern region, which accounted for nearly 90% of exports, recovered an overall growth of 1.6%, while the central region and western region decreased by 4.9% and 4.2% respectively.
As the core area of the Silk Road Economic Belt, Xinjiang has unique location advantages and resource endowments. In recent years, with the advancement of the national industrial policy for local investment, Xinjiang has further accelerated the pace of industrial transfer from coastal areas, and its exports have achieved double digits for two consecutive years. Number growth. In 2017, exports amounted to US$6.37 billion, an increase of 21.7%, and China’s exports jumped to the 7th place in the national export rankings.
6. The proportion of clothing imports continues to increase, and the volume and price of textile imports have increased.
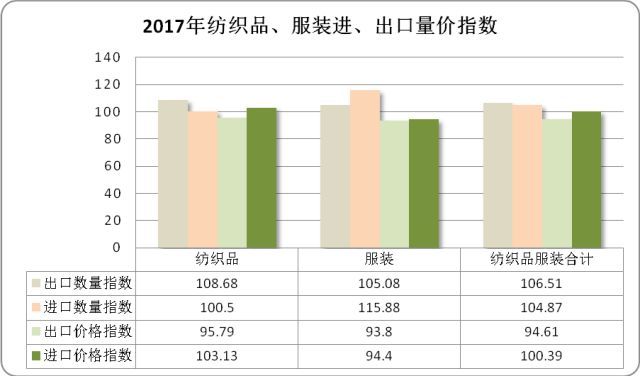
With the gradual reduction of import tariffs on consumer goods, the volume of clothing imports has increased rapidly, and the proportion of clothing imports has also gradually increased. Clothing imports in 2017 were US$7.18 billion, an increase of 9.4%, and the proportion rose to 29.2%. The main factor driving clothing imports is quantity growth. The clothing import quantity index is 115.9 and the import price index is 94.4. Among them, the import volume of large categories of needle-woven clothing increased by 13.4%, and the average import price fell by 4.3%.
Textile imports amounted to US$17.38 billion, an increase of 3.7%, reflecting an increase in both volume and price. The import quantity index is 100.5, and the import price index is 103.1. The import value of major categories of commodity yarns and finished products both increased by 6.2%, while fabrics decreased by 1.3%. The import volume of cotton yarn, a key commodity, fluctuates with the timing of the cotton reserve rollout. During the cotton reserve rollout, the import volume of outer yarn fell sharply. After the cotton reserve rollout ended, the import volume of outer yarn rebounded. The cumulative import volume for the whole year increased slightly by 0.6%, and the average import price increased by 5.9%.
AAA anti-UV fabric net EHRYJUTUTHYER

