1. In early September, the national cotton industry inventory usage was about 37.9 days
A sample survey of the National Cotton Market Monitoring System showed that as of early September, the average cotton inventory usage of the sampled companies The number of days is approximately 37.9 days (including the quantity of cotton imported into Hong Kong), an increase of 0.5 days month-on-month and 1.0 days year-on-year. The national cotton industry inventory is estimated to be approximately 882,000 tons, an increase of 2.6% month-on-month and 24.6% year-on-year (see table and figure 1). The cotton industry inventory situation in major provinces across the country is different. The cotton industry inventory discount days in Xinjiang, Hubei, and Jiangsu provinces are relatively high (Figure 2).
2. The willingness to purchase raw materials decreased month-on-month and the intention to allocate cotton was stable
The purchasing intention survey showed that in early September, 62.1% of the companies were prepared to purchase cotton, a decrease of 4.5 percentage points month-on-month and an increase of 7.7 percentage points year-on-year; 34.8% held a wait-and-see attitude, a decrease of 4.5 percentage points month-on-month. An increase of 7.6 percentage points, a year-on-year decrease of 5.7 percentage points; companies that do not plan to purchase cotton accounted for 3%, a month-on-month decrease of 3.0 percentage points, and a year-on-year decrease of 2.0 percentage points (Figure 3).
In early September, 92.4% of the sampled companies planned to stabilize the cotton ratio, an increase of 1.5 month-on-month. percentage points, a decrease of 2.5 percentage points year-on-year; 1.5% of enterprises plan to increase the cotton allocation ratio, a decrease of 1.5 percentage points month-on-month and a year-on-year decrease of 2.3 percentage points; 6.1% of enterprises plan to reduce the cotton allocation ratio, which is the same as the previous month and an increase of 4.8 percentage points year-on-year ( As shown in Figure 4).
3. The company’s capital turnover is good
The fund turnover survey showed that at the beginning of September, 58.5% of the companies had good capital turnover, an increase of 7.7 percentage points from the previous month, and a year-on-year increase of 6.6 percentage points; 29.2% had poor capital turnover, a decrease of 2.1% from the previous month. percentage points, a year-on-year decrease of 3.7 percentage points; 12.3% were seriously short of funds, a month-on-month decrease of 5.6 percentage points, and a year-on-year decrease of 2.9 percentage points (Figure 5).
At the beginning of September, 65.7% of the sampled enterprises had normal employment conditions, a month-on-month decrease of 1.0 percentage points. A year-on-year decrease of 1.4 percentage points; 26.9% of enterprises have poor labor employment conditions, a decrease of 0.7 percentage points from the previous month, and an increase of 2.8 percentage points year-on-year; 7.5% of enterprises are seriously short of workers, an increase of 1.7 percentage points from the previous month, and a decrease of 1.4 percentage points year-on-year (Figure 6 ).
Four. Enterprise startup rate Month-on-month decrease
In early September, the operating rate of the sampled companies was 91.6%, a month-on-month decrease of 2.1 percentage points.
5. The production and sales rate of yarn and cloth decreased and the inventory of finished products increased
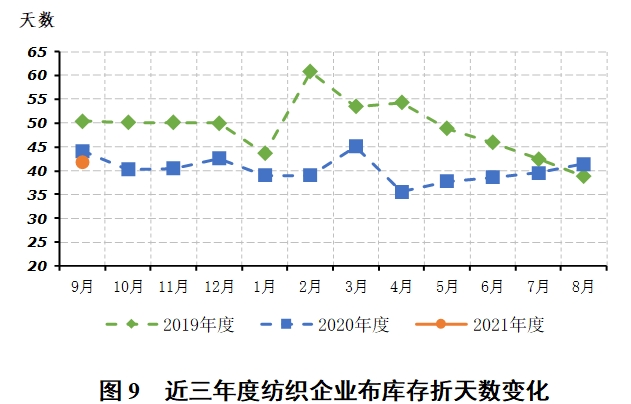
In early September, the yarn production and sales rate of the sampled enterprises was 90.8 %, a month-on-month decrease of 2.6 percentage points, a year-on-year increase of 2.1 percentage points, and a decrease of 6.0 percentage points from the average level of the same period in the past five years (2015-2019); inventory is 14.9 days of sales, a month-on-month increase of 1.7 days, a year-on-year decrease of 10.5 days, and a year-on-year decrease of 10.5 days. In the past five years (2015-2019), the average level during the same period has decreased by 5.6 days (Figures 7 and 8). The production and sales rate of cloth was 84.7%, a month-on-month decrease of 0.1 percentage points, a year-on-year decrease of 1.1 percentage points, and a decrease of 8.0 percentage points from the average level of the same period in the past five years (2015-2019); the inventory was 41.8 days of sales, a month-on-month increase of 0.4 days, It decreased by 2.4 days year-on-year and 4.2 days less than the average level of the same period in the past five years (2015-2019) (Figure 7 and Figure 9).
 </p
</p

